📊 Lead Analytics Dashboard
Gain a comprehensive, real-time view of your sales funnel and lead generation performance.
The Lead Management Dashboard transforms lead data into visual intelligence. Monitor how many leads are entering your system, identify which marketing channels are most effective, and track how prospects move through your custom sales stages—all from one centralized command center.
🔑 Key Features at a Glance
-
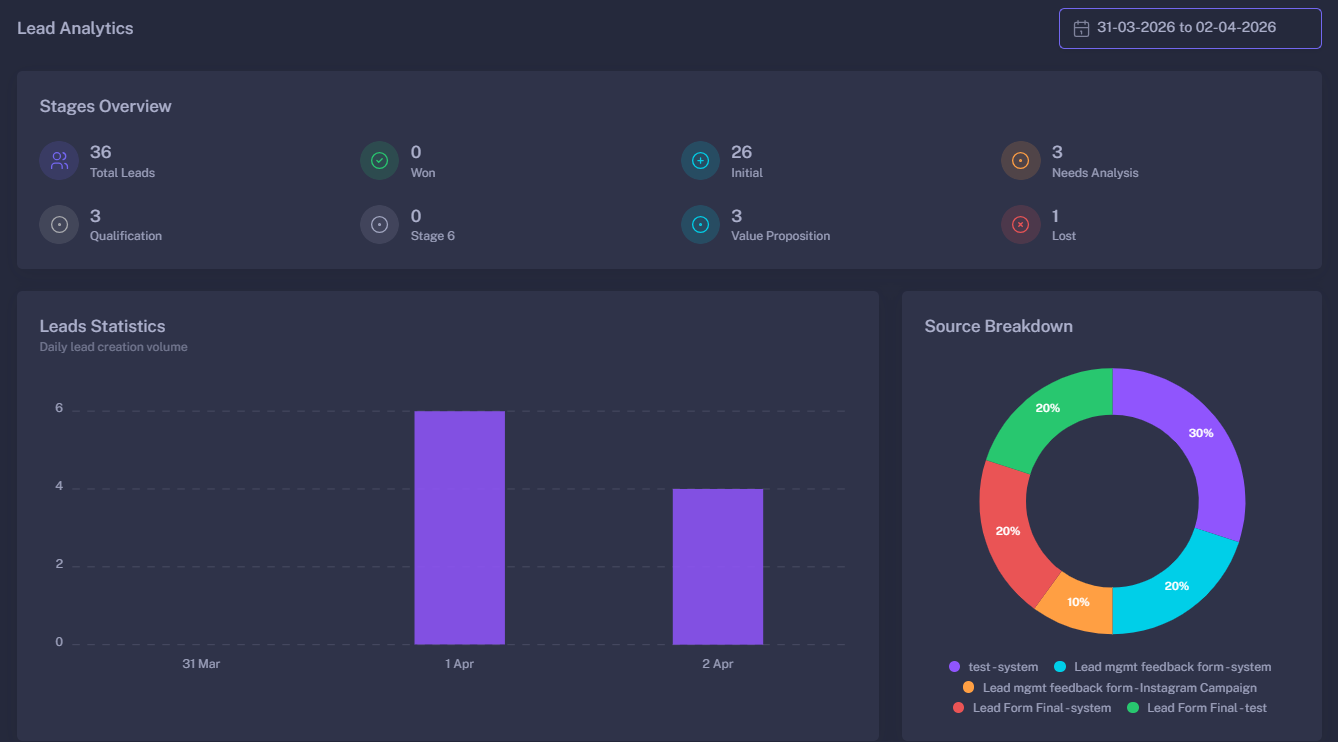
Stages Overview: A high-level summary of your entire pipeline. Instantly see the total number of leads and their distribution across stages like Initial, Won, Lost, and any custom stages you’ve defined.
-
Lead Volume Statistics: An interactive bar chart visualizing Daily Lead Creation. This helps you identify trends, peak generation days, and the impact of specific marketing pushes over time.
-
Source Breakdown (Attribution): A detailed donut chart that reveals exactly where your leads are coming from. It breaks down leads by Form Title and specific Source (e.g., Instagram, WhatsApp, Web), allowing for precise ROI calculation.
-
Time-Travel Analytics: Use the built-in date range picker to compare performance across different periods—from daily snapshots to quarterly reviews.
📊 Dashboard Metrics Explained
🪜 Stages Overview
This section tracks the health of your sales pipeline by counting leads in every defined stage.
| Metric | Description |
|---|---|
| Total Leads | The absolute count of all leads captured within the selected timeframe. |
| Won | Leads that have successfully reached the final conversion stage. |
| Lost | Leads that have been marked as “Lost” or unqualified. |
| Custom Stages | Dynamic counts for your specific business flow (e.g., Follow-up, Proposal Sent, Negotiating). |
📈 Leads Statistics (Bar Chart)
Visualizes the velocity of your lead generation.
- X-Axis: Time (Days/Months).
- Y-Axis: Number of Leads.
- Utility: Helps identify if your lead flow is consistent or if there are significant drops that require immediate attention.
🍩 Source Breakdown (Donut Chart)
The ultimate tool for Marketing Attribution.
This chart maps every lead back to the specific form and link they used to enter your system.
- Granular View: See data formatted as
[Form Name] - [Source Name](e.g., Contact Us - Instagram Ad). - Optimization: Identify which platforms are “High Volume” and which are “High Quality” to better allocate your marketing budget.
🎛 Filters & Customization
- Date Range Selector: Choose specific start and end dates. The dashboard automatically calculates statistics based on your local timezone.
- Live Updates: The dashboard refreshes based on your selection, providing an immediate snapshot of current productivity.
- Dynamic Legends: Interaction with chart legends allows you to toggle specific data points on or off for clearer analysis.
🚀 Strategic Benefits
- Identify Bottlenecks: If “Total Leads” are high but “Won” leads are low, you can quickly spot where the pipeline is stalling.
- Measure Campaign Success: Connect your marketing efforts directly to lead counts. If an Instagram campaign is active, the Source Breakdown will validate its performance in real-time.
- Data-Driven Sales Strategy: Use historical trends in lead volume to predict future sales and set realistic team targets.
- Optimize Lead Capture: Compare different forms to see which ones have the highest conversion rates and best attribution.
With Lead Analytics, you move beyond guessing and start growing your business based on hard data.