📊 Feedback Analytics Dashboard
Transform customer voices into measurable intelligence.
The Feedback Management Dashboard provides a dual-layered view of your customer experience. It allows you to monitor the operational lifecycle of submissions through Status Analytics and evaluate the actual quality of service through Performance Segmentation. By centralizing these metrics, businesses can identify friction points and celebrate service excellence in real-time.
🔑 Key Features at a Glance
- Status Overview: Track the journey of every feedback entry from “New” to “Positive” resolution. This view ensures no customer response is left unaddressed.
- Performance Segmentation: Automatically categorizes feedback into Good, Satisfactory, or Poor based on customer scores, allowing for immediate quality assessment.
- Form-Wise Deep Dives: Detailed tables break down performance by specific forms, showing average scores and distribution counts for granular analysis.
- Interactive Navigation: Click on any Form Title within the dashboard to jump directly to the filtered list of responses for that specific category.
🪜 Status Analytics
Focuses on the Operational Workflow of your feedback loop.
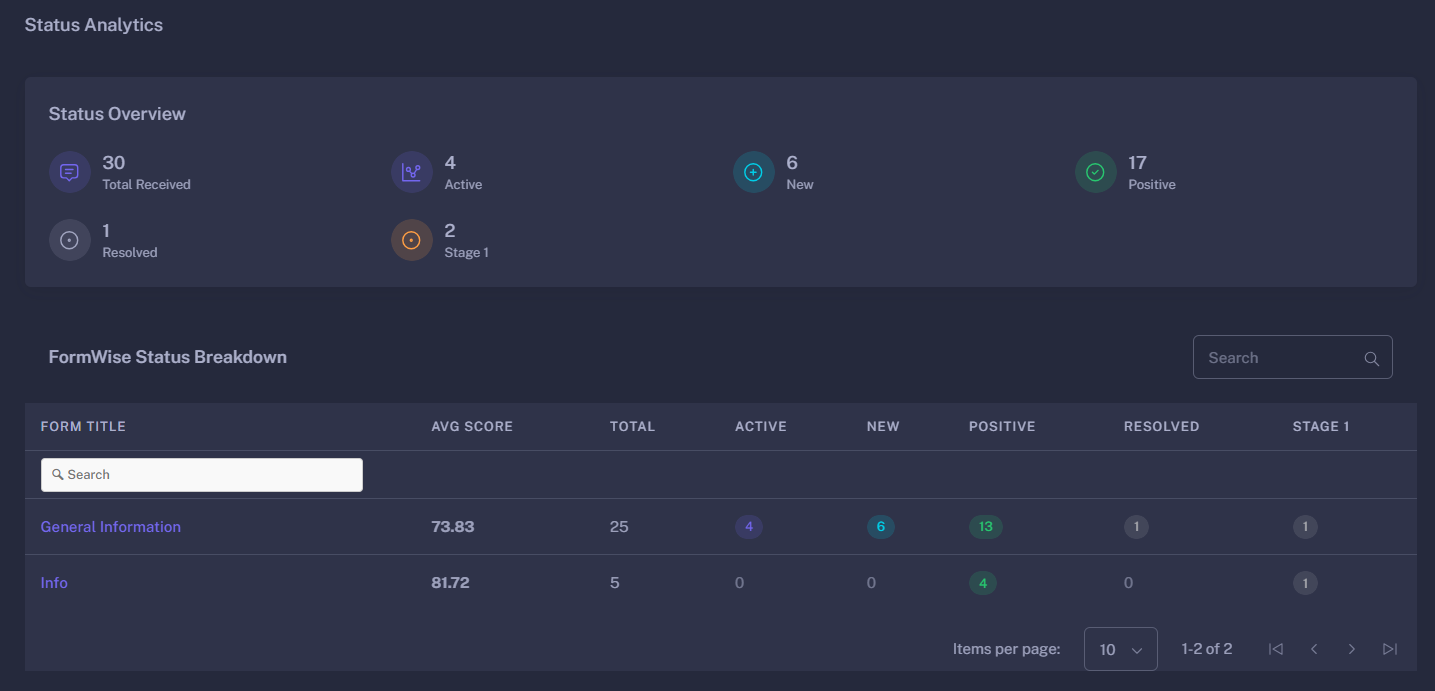
Workflow Metrics
This section counts submissions across your defined lifecycle stages:
- Total Received: The absolute volume of feedback entries captured.
- New: Recently submitted entries awaiting initial review.
- Active: Feedback currently being processed or investigated by the team.
- Positive: Feedback that has reached a successful resolution or represents a satisfied customer.
Form-Wise Status Breakdown
A comprehensive table showing how statuses are distributed across different collection points (forms). It displays the Average Score per form, helping you identify which touchpoints are performing best.
📉 Segmentation Analytics
Focuses on the Quality of Experience within a selected time range.
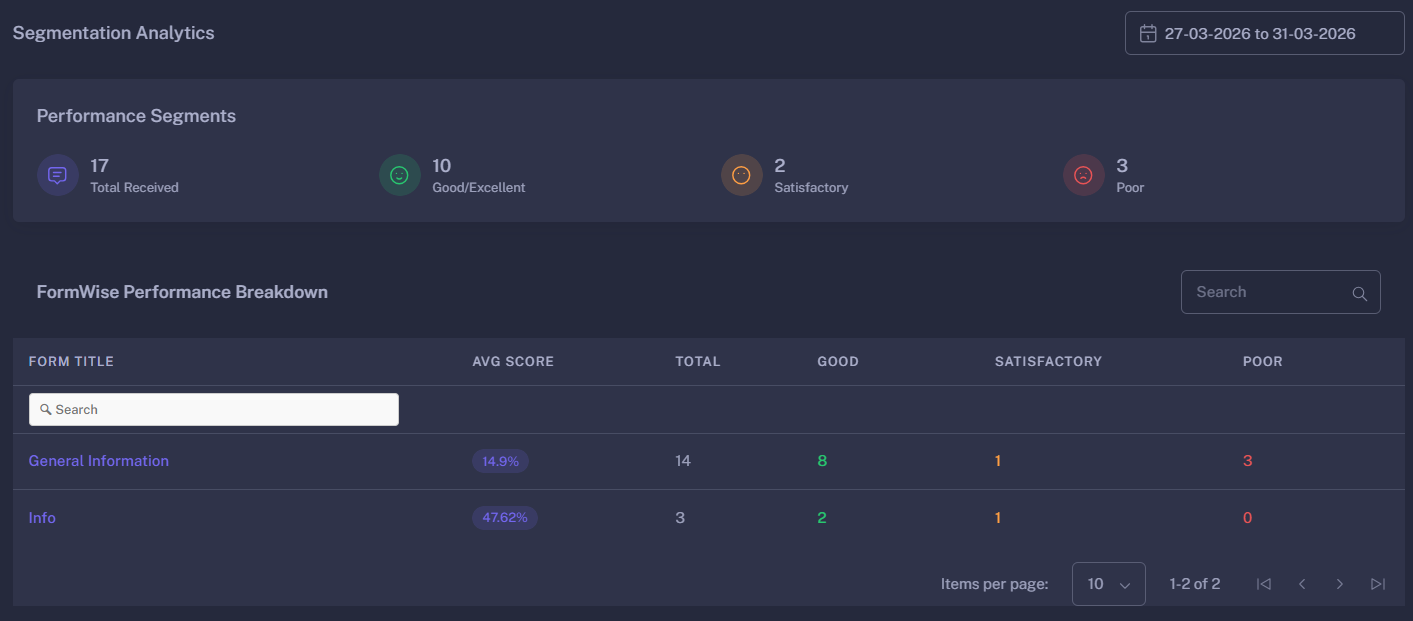
Performance Segments
Using the date-range filter, the system segments feedback based on the scores provided by customers:
- Good/Excellent: High-satisfaction responses that validate current processes.
- Satisfactory: Neutral feedback that indicates room for minor improvements.
- Poor: Critical feedback that requires immediate attention and root-cause analysis.
Form-Wise Performance Breakdown
This data table provides a percentage-based Average Score for each form. High-performing forms are highlighted in Success (Green), while those requiring attention are flagged for review.
🎛 Filters & Customization
- Date Range Picker: Analyze performance across specific days, weeks, or months. The “Performance Segments” update dynamically to reflect the data within your chosen timeframe.
- Timezone Alignment: Statistics are calculated based on your local configuration (
Asia/Kolkataby default), ensuring data accuracy for daily reports. - Cross-Module Sync: The dashboard pulls form titles and codes directly from your Form Builder, ensuring that new feedback channels appear on the dashboard automatically.
🚀 Strategic Benefits
- Close the Loop Faster: Use the Status Overview to identify if “New” feedback is piling up, indicating a need for more resources.
- Identify Trends: Monitor the “Average Score” over time to see if business changes are positively or negatively impacting customer sentiment.
- Targeted Improvements: If a specific form shows a high “Poor” segment, you can deep-dive into those specific responses to fix the underlying issue.
- Evidence-Based Decision Making: Use the segmentation percentages to report on overall Customer Satisfaction (CSAT) to stakeholders with hard data.
With Feedback Analytics, every customer opinion becomes a data point for growth.